Overprescribed: Mapping Prescriptions of Dangerous and Addictive Drugs to the Elderly


Many prescription drugs have the potential to harm elderly individuals who take them. Some in particular have been deemed to have such high risks relative to their benefits that the American Geriatrics Society explicitly advises against prescribing them to persons aged 65 or over in an advisory document called the Beers List.
In the past, it was extremely difficult to know how many elderly patients across the United States were being prescribed these ill-advised medications. This changed in May 2013, when a court injunction that had been in place since 1979 was lifted. This injunction previously had prevented the Centers for Medicare & Medicaid Services (CMS) from publicly releasing prescriber-level data from Medicare‘s Part D program – the portion that pays for prescription medication for almost 30 million seniors across the nation.
Also for the first time, in 2013, Medicare began covering claims for barbiturates and benzodiazepines, two categories of drugs that, according to the Beers List, should not be prescribed to older people because of their potential for causing dependence and other negative side effects – but they nevertheless are, with prescriptions numbering in the millions.
We’ve analyzed the most recent data set released by CMS to discover how often potentially dangerous and addictive drugs from the Beers List, including barbiturates and benzos, are prescribed to 65+-year-olds and where in the country rates are highest.
About the Data
In 2013 – the most recent year for which data is available (released by CMS in April 2015) – 35.7 million people had their prescription drugs paid for by Medicare’s Part D program, and 82% of them were aged 65 or over. The 2013 Part D data set includes records of more than 1 billion prescription claims issued by over a million distinct health care providers, who collectively prescribed $103 billion in prescription drugs.
Because the 2013 CMS data detail prescriptions at the level of individual doctors, CMS has redacted figures for records that included fewer than 11 claims in order to protect patients’ privacy. Rather than omit these records, which would have excluded millions of 65+-year-olds, we spoke to CMS about how best to reinstate the redacted numbers. Thanks to their advice and additional data they kindly supplied, we have been able to establish the estimates you will see mapped below without compromising patient anonymity.
The drugs we will focus on, with the exception of those in the Addiction Medication section near the end, all come from the Beers List, which is compiled by a multidisciplinary panel of experts in geriatric medicine for the American Geriatrics Society and was last updated in 2012. We have selected categories of drugs from the list that are strongly not recommended for use by 65+-year-olds because of the likelihood of causing dependence, withdrawal symptoms, and other harmful side effects.
The table below shows the categories of drugs we have chosen to focus on and describes what they are as well as why they are bad for elderly people.

Benzodiazepine
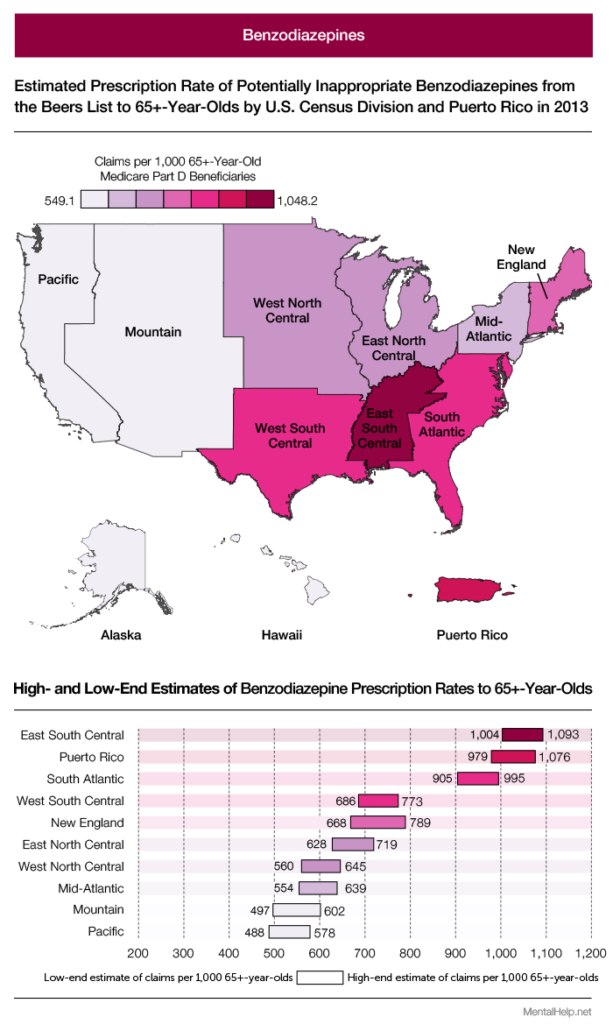
Benzodiazepines, or benzos, are better known by their brand names. Diazepam, for example, is more commonly known as Valium; alprazolam is Xanax; and lorazepam is Ativan. They are all psychoactive drugs used to sedate, induce sleep, and relieve anxiety. When used at prescribed doses by younger people, they’re generally accepted to have legitimate, if short term, medical benefits. Older people can react adversely to any type of medication, but in particular, tend to experience more of the negative side effect profile of benzodiazepines – which can include memory problems, mood changes, daytime sedation and impaired motor coordination. The AGS strongly advises against the use of benzos by elderly people, whether they are short-acting, like lorazepam, or long-acting, like diazepam. However, the use of benzos by older people is widespread: A recent study in JAMA Psychiatry revealed that 9% of 65- to 80-year-old Americans use one of these sedative-hypnotics. And among older women, 11% use them.
The map and table above show benzo claims (including refills) per 1,000 65+-year-old Part D beneficiaries. Elderly people in the East South Central Census region were prescribed the drugs at the highest rate in 2013 – about twice that of Pacific beneficiaries. Puerto Rico, which isn’t a Census region, but which we’ve included because it plays such a prominent role in the results, ranked second highest.

When we split the census divisions into their constituent states, as we have above, the extent of the South’s heavy use of benzos in the over 65 population becomes even more apparent. West Virginia ranks highest, with a prescription rate more than five times higher than Hawaii, which ranked lowest.
This isn’t the first time West Virginia and benzodiazepines have been mentioned together.
In 2014, the Centers for Disease Control released data showing that West Virginia had the highest prescription rate of benzodiazepines in the country (across all people, not just older people who use the Part D program) and, just like in our findings, Hawaii had the lowest – a 3.7 fold difference between them. Let’s see how Part D prescriptions differed by the specific type of benzodiazepine.
Alprazolam (Xanax) was the most-prescribed benzodiazepine in 2013, with a total of 39.2 million claims covered across all beneficiaries. Somewhere between 19.4 million and 22 million of those went to 65+-year-olds, who – according to the Beers List – should very rarely, if ever, be prescribed them at all. While West Virginia had the highest prescription rate for alprazolam (and three of the other nine benzos we included), Miami was the city with the most claims in total, possibly because of the demographic make-up of its population, which contains a lot of retirees.
The dangers of taking benzos increase for older people the longer they take them. If they are to be taken, the usual recommended duration is two to four weeks, to avoid becoming dependent and suffering debilitating side effects. Using CMS’s data, we were able to see how benzo claims by 65+-year-olds in 2013 differed by duration (total days supply).
In any age group, adverse drug reactions are bound to occur. In an older population, however, they can occur with startling regularity. When the specific drugs giving rise to these reactions have psychoactive effects and/or have demonstrable abuse potential, a potentially volatile situation is created. Cognition stands to be obtunded or dulled; the risk for accidents and bodily harm increases. Morbidity and, indeed, mortality rates can skyrocket when pharmaceuticals aren’t precisely administered, and when medication lists aren’t periodically scrutinized and culled of any potential dangers.

Nearly one-third of benzodiazepine prescriptions those 65 and older in 2013 totalled more than four weeks in duration. When a senior adviser at the National Institute of Mental Health looked into benzo prescription data from 2008, which included prescriptions from 60 percent of all retail pharmacies in the United States, he and his colleagues found similarly alarming results: Nearly a third of people aged 65 to 80 had taken benzos for more than 120 days. It appears, then, that benzo prescriptions dispensed to older people are not only a problem found in the Part D program, but also private medical programs.
For much of the 20th century, barbiturates were used to manage the problems benzos are now prescribed for. But, despite being on the Beers List, they continue to be prescribed to older people (and covered by Part D).
Barbiturates
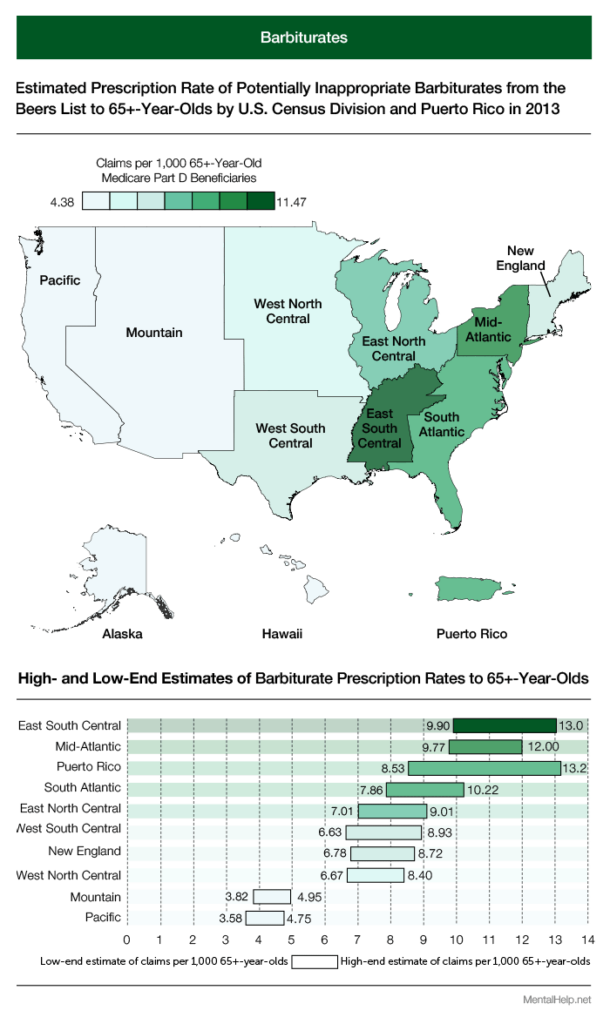
The problem with barbiturates for 65+-year-olds is that they have a much narrower margin of safety than other drugs and are highly addictive. This is why they’ve largely been replaced by benzodiazepines. Medicare pays for them, but it places restrictions on what medical conditions they can be prescribed for (unlike benzos, which have no such restrictions). Barbiturates can only be prescribed to Part D patients who have epilepsy, cancer, or a chronic mental disorder. Restrictions or not, the map above of barbiturate claims per 1,000 patients looks extremely similar to the benzo map. East South Central once again ranks highest.
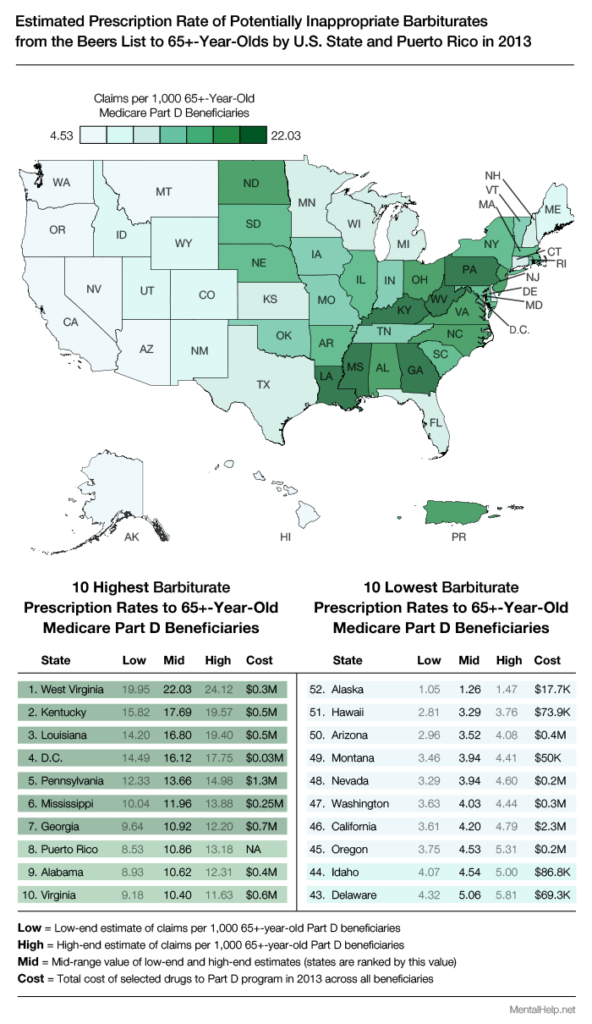
West Virginia ranks highest when we break the barbiturate data down by state, as it did for benzos, and Kentucky is in second place (fourth for benzos). Many of the states in the bottom 10 for barbiturates – like Alaska and Hawaii – were also in the bottom 10 for benzos. Let’s see if this holds true for our next category of potentially inappropriate drugs.
Muscle Relaxants

Muscle relaxants are used to treat back and neck spasms, among other conditions, which are especially common in the older population. However, this category of drug is poorly tolerated by elderly patients and as such appears on the Beers List of potentially inappropriate medications for people aged 65 and older. The South (specifically East South Central) once again has far more claims per 1,000 patients than other parts of the country, with Alabama in the top spot.

Medicare’s Part D program paid for 7.9 million muscle relaxant claims in 2013, costing
$170 million. Between 1.7 million and 2.7 million of those were for 65+-year-olds, and the majority were for one muscle relaxant in particular: cyclobenzaprine (more commonly known by its brand name, Flexeril). Houston was the city with the most claims for this drug, which actually has a closer association with the second-most-prescribed muscle relaxant: carisoprodol (brand name, Soma). When combined with opiates and benzodiazepines, carisoprodol is nicknamed The Houston Cocktail, because of Houston’s close association with the infamous concoction, which is said to produce a heroin-like high. Carisoprodol doesn’t have to be combined with other drugs to be dangerous, though. SAMHSA found that between 2004 and 2009, visits to the ER caused by the drug more than doubled, from 15,830 to 31,763. And the increase was even more dramatic for people over age 50, whose visits tripled. Another drug that’s made the headlines for causing trips to the emergency room is a sedative-hynotic alternative to benzodiazepines called zolpidem (Ambien). It, of course, appears on the Beers List and is prescribed in the millions through Part D. But will the Southern states continue to dominate the tables?
Zolpidem
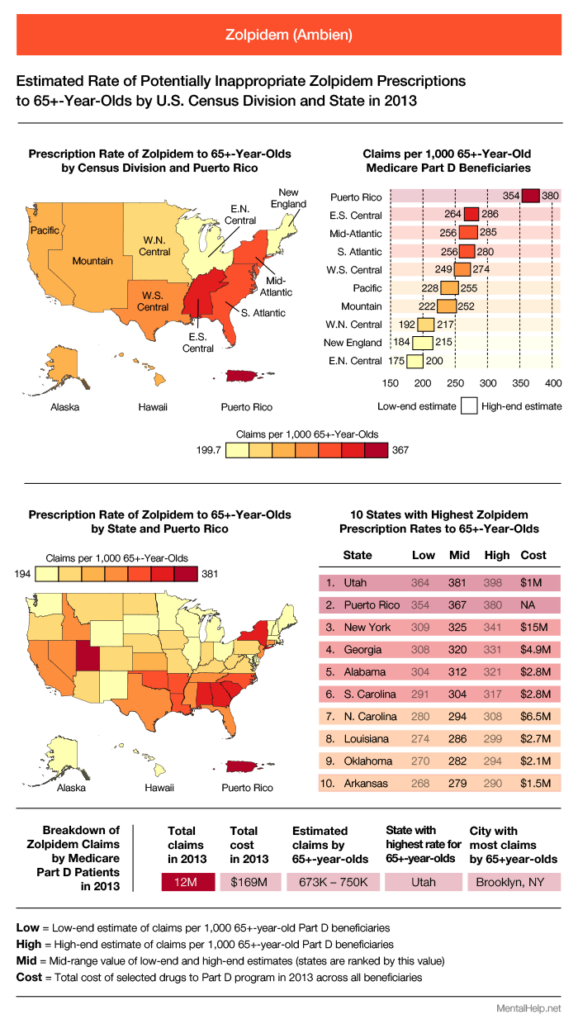
Zolpidem, better known as Ambien, is a drug used for the short-term treatment of insomnia. It belongs to the “Z-Drugs” category: a group of drugs with effects similar to benzodiazepines. Zolpidem has received quite a lot of negative news coverage, after emergency room visits caused by the drug rose 220% between 2005 and 2010. One in three visits in 2010 involved adults aged 65 or older, and 16% of the total number were caused by a mix of zolpidem and benzodiazepines. In fact, from 2009 through 2011, zolpidem was implicated in 21% of all trips the ER by those aged 65 and up – that’s one out of every five visits across all elderly people.
It’s no wonder that in January 2013, the FDA amended the prescribing guidelines for Ambien, Ambien CR, Edluar, and Zolpimist (all zolpidem-containing drugs). The recommended dose for women was halved. The hope is that there will be fewer accidents, like falls and motor vehicle collisions, caused by the mental impairment zolpidem can produce – even a full day after taking the treatment.
Southern states once again appear in the top portion of the ranking for claims by 65+-year-old Part D beneficiaries, but this time a non-Southern state, Utah, is in the top spot. Brooklyn, New York, was responsible for more claims than any other city in 2013, with somewhere between 97,000 and 103,000 claims, including refills. Across all Part D beneficiaries, Medicare paid for 12 million zolpidem claims at a cost of $169 million, of which between 673,000 and 750,000 were for adults aged 65 or over.
Before summing up the results for benzos, barbiturates, muscle relaxants, and zolpidem, let’s take a look at how two drugs intended to combat addiction were prescribed to elderly people in 2013 and see if their maps mirror the ones we have seen so far.

There are only a few drugs that are exclusively utilized for the treatment of drug addictions. Buprenorphine, for example, is often used to treat opioid addiction, but it is also used to manage elderly patients’ pain. Therefore, mapping buprenorphine prescriptions would produce a mix of the two purposes. Instead, we have chosen to map two drugs that are exclusively used to combat opioid and alcohol dependence: Suboxone (a combination of buprenorphine and naloxone), and naltrexone. Neither is on the Beers List, but both are relevant to the topic of drug dependence.
Suboxone is shown above and, at a glance, we can see it has a bit in common with the maps for the Beers drugs, but also shows some differences. For instance, Tennessee appears in the top five, as it did for muscle relaxants and benzodiazepines, but D.C. is highest of all, followed by Rhode Island. Puerto Rico – which placed in the top 10 for every Beers category except muscle relaxants – is 50th out of 52 states/territories. About 10% of the 450,000 Part D prescriptions for Suboxone in 2013 were for people aged 65 and over. Naltrexone, shown below, which like Suboxone is used to help people combat opioid and alcohol addictions, showed the same ratio (90% of beneficiaries were under 65; 10% were over).

Rhode Island, which was second for Suboxone, ranked highest for naltrexone claims per 10,000 beneficences, and D.C. placed 5th highest, whereas for Suboxone it was first. Puerto Rico was 50th once more. The distribution of the top 10 states for both Suboxone and naltrexone are more dispersed across the country than any of the four Beers drug categories, which all centered around Southern states. The big question is why prescribers in the South have been writing prescriptions for these potentially inappropriate drugs at a higher rate than anywhere else.
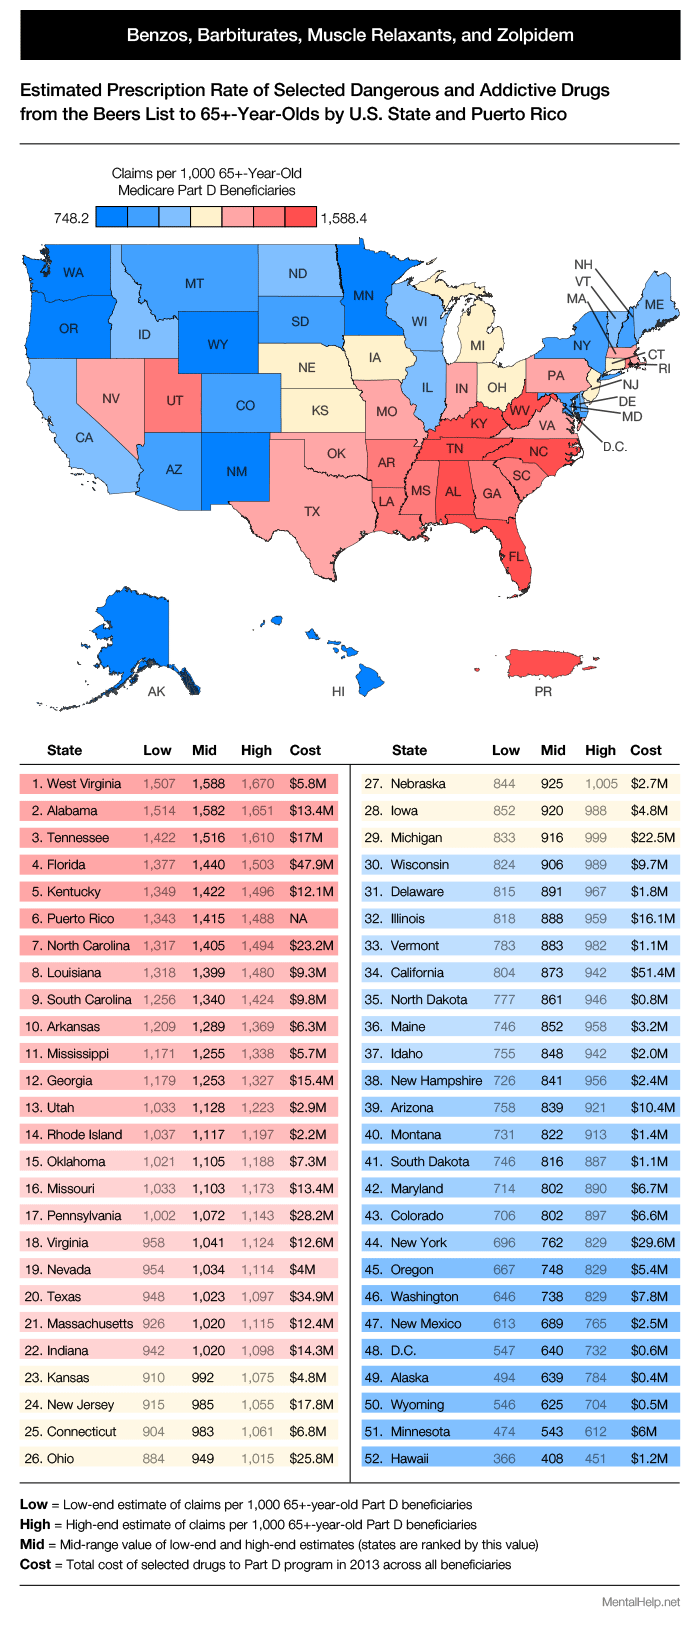
Summary
The map and table above combine the claim totals for all four Beers drug categories we’ve looked at to form an ultimate ranking of which states prescribed potentially inappropriate drugs to seniors at the highest rates in 2013. The top 12, except for Puerto Rico, are all in the South. One possible explanation for this could be that elderly people in the South suffer from more medical conditions that benefit from Beers drugs than elsewhere. But this theory is ruled out by a Morbidity and Mortality Weekly Report released by the CDC in July 2014. The report summarizes the results of a CDC study that analyzed a commercial database of benzodiazepine and opioid pain reliever prescriptions from 2012 (a year earlier than our Medicare 65+-year-old data). The CDC also discovered that there were significant regional differences in prescription rates (across all age groups):
“For both OPR and benzodiazepines, rates were higher in the South census region, and three Southern states were two or more standard deviations above the mean.”
They couldn’t determine the factors accounting for the regional differences, but did say this:
“Such wide variations are unlikely to be attributable to underlying differences in the health status of the population. High rates indicate the need to identify prescribing practices that might not appropriately balance pain relief and patient safety.”
In other words, elderly people in the South probably don’t have illnesses that require these dangerous and potentially addictive drugs more than anywhere else. Rather, prescribers in the South just seem to be prescribing them more often. And these inappropriate prescribing practices – which the CMS data has now confirmed extends to elderly people through the Part D program – must be identified and, ideally, rectified.
Conclusion
In recent years, more and more attention seems to be placed on the health ramifications of problematic substance use in the general population. Still, our elderly demographic – a group that could use more, not less attention – clearly continues to suffer from indiscriminate, sometimes questionable prescribing practices.
We are a health technology company that guides people toward self-understanding and connection. The platform provides reliable resources, accessible services, and nurturing communities. Its purpose is to educate, support, and empower people in their pursuit of well-being.
We take mental health content seriously and follow industry-leading guidelines to ensure our users access the highest quality information. All editorial decisions for published content are made by the MentalHealth.com Editorial Team, with guidance from our Clinical Affairs Team.
Further Reading
We are a health technology company that guides people toward self-understanding and connection. The platform provides reliable resources, accessible services, and nurturing communities. Its purpose is to educate, support, and empower people in their pursuit of well-being.